Local LLM benchmark record: hardware, models, engines, and results

This is both the benchmark record and the practical starting guide I wish I had for the Intel Arc Pro B60. It records what was tested, the configuration that worked, the configurations that failed, and enough detail for another Intel GPU owner to reproduce the important comparisons. The accompanying B60 story covers the persistence and decisions behind the numbers.
All figures below are observations from my machine, not vendor estimates. Results from different models and engines are labelled rather than treated as directly interchangeable. The benchmark scripts and raw results live at github.com/srmiles/local-llm-benchmarks.
Benchmark snapshot
| Field | Value |
|---|---|
| Original benchmark period | June 2026 |
| Record updated | 26 July 2026 |
| Primary use case | Single-user coding agent with sequential tool calls |
| Baseline | LM Studio Vulkan, Gemma 4 26B-A4B |
| Locked comparison | llama.cpp SYCL, Gemma 4 26B-A4B Q4_K_M |
| Headline result | 180s → ~24s first review; 30s → ~0.7s subsequent tool calls |
| Scripts and raw data | github.com/srmiles/local-llm-benchmarks |
Result scope: the 0.55–0.7 second figure is a cache-reused follow-up in a sequential agent conversation. It is not cold model latency or time to generate a complete answer. Cold 12K prefill remained 22.8 seconds in the locked Gemma comparison.
Test system
| Component | Configuration |
|---|---|
| GPU | Intel Arc Pro B60, 24 GB GDDR6 |
| CPU | Intel Core i7-8700, 6 cores / 12 threads |
| Host RAM | 27 GB |
| Model storage | 492 GB on /data/llm |
| Driver stack | Intel xe, Mesa 25.0.7 Vulkan, oneAPI 2025.3.3 SYCL |
| Original OS | Ubuntu 25.04 VM on Proxmox VE 6.17 with VFIO passthrough |
| Primary workload | Sequential coding-agent tool calls with 5–20K tokens of working context |
| Production model | Gemma 4 26B-A4B, Q4_K_M GGUF |
| Production engine | llama.cpp SYCL, custom GGML_SYCL_F16=ON build |
The table above describes the original controlled comparison. The same B60 later moved to bare-metal Ubuntu 26.04 (kernel 7.0) on a Ryzen 5 5500GT with 32 GB RAM. Inference stayed close to VM performance, confirming that the GPU and software path, not the older CPU, were the main limit. The kernel change mattered more than the CPU change; see the Ornith warm-cache result below. The current service uses Ornith 9B for agent and knowledge work; the Gemma configuration remains the reproducible baseline because it has the complete before/after matrix.
Recommended B60 starting configuration
For a single-user coding agent and a model that fits in 24 GB, start with:
| Setting | Starting value | Evidence from this B60 |
|---|---|---|
| Backend | Current llama.cpp Intel/SYCL image | Beat the tested Vulkan and vLLM-XPU agent paths |
| Device | ONEAPI_DEVICE_SELECTOR=level_zero:0 |
Selects the Arc GPU through Level Zero |
| GPU layers | -ngl 99 |
Keeps model layers on the GPU |
| Flash attention | -fa on |
Required for the successful cache-reuse path |
| Batch | -b 2048 -ub 2048 |
477 tok/s versus 388 at 512; 4096 regressed |
| Parallel slots | --parallel 1 |
Matches a single sequential agent workload |
| Chat formatting | --jinja |
Preserves tool-call and tool-response formatting |
| Context | -c 131072 |
Long agent context; choose lower if the model/runtime needs headroom |
| Output guard | --predict 2048 |
Prevents runaway output when clients send an unlimited value |
| Prompt cache | --cache-ram 0 |
Avoided second-request hangs seen with Gemma SWA |
| Model loading | --no-mmap |
Forces a predictable load rather than demand paging |
| Build option | GGML_SYCL_F16=ON |
+26% cold prefill in the controlled Gemma suite |
A minimal Docker launcher matching the locked comparison is:
docker run --rm \
  --device /dev/dri \
  --group-add "$(getent group render | cut -d: -f3)" \
  --group-add "$(getent group video | cut -d: -f3)" \
  -v /path/to/models:/models:ro \
  -p 8002:8000 \
  -e ONEAPI_DEVICE_SELECTOR=level_zero:0 \
  llama.cpp:sycl-f16 \
  -m /models/gemma-4-26B-A4B-it-Q4_K_M.gguf \
  -ngl 99 -c 131072 --parallel 1 \
  --host 0.0.0.0 --port 8000 \
  --cache-ram 0 --no-mmap --metrics \
  -fa on -b 2048 -ub 2048 \
  --jinja --predict 2048
Build the custom image from the llama.cpp Intel Dockerfile at the revision you intend to test:
docker build --build-arg GGML_SYCL_F16=ON --target server \
  -f .devops/intel.Dockerfile -t llama.cpp:sycl-f16 /path/to/llama.cpp
Pin the llama.cpp revision and record the GPU driver, compute runtime, IGC, and oneAPI versions beside every result. Upstream changes quickly enough that an unversioned "llama.cpp result" is not reproducible.
Engines compared
| Engine | Model used | Best observed strength | Agent-loop limitation |
|---|---|---|---|
| LM Studio Vulkan | Gemma 4 26B-A4B Q4_0 QAT | Easy setup | Broken prefix reuse in this configuration; flash attention crashed on the tested stack |
| vLLM-XPU | Qwen2.5-Coder-14B AWQ | 1,891 tok/s peak; ~1,857 tok/s typical prefill | 22.9 tok/s peak and 13–15 tok/s typical decode; incomplete MoE/tool-parser coverage |
| llama.cpp SYCL | Gemma 4 26B-A4B | Working flash attention, clean tool streaming, strong decode and cache reuse | Required current Intel image and workload-specific tuning |
The vLLM result is a useful warning: the engine with the highest peak prefill number was not the fastest engine for a single-user agent loop. Decode, repeated-prefix reuse, tool formatting, and runtime stability mattered more.
Model comparison
The counterintuitive result was that the larger mixture-of-experts model ran faster than the smaller dense model because only 4B parameters are active per token.
| Model | Prefill at 1K | Prefill at 4K | Decode |
|---|---|---|---|
| Gemma 4 26B-A4B MoE | 672 tok/s | 834 tok/s | 38.6 tok/s |
| Gemma 4 12B dense | 167 tok/s | 126 tok/s | 19.7 tok/s |
Model size alone is not a useful predictor of latency. Architecture and active parameters matter.
Engine and configuration progression
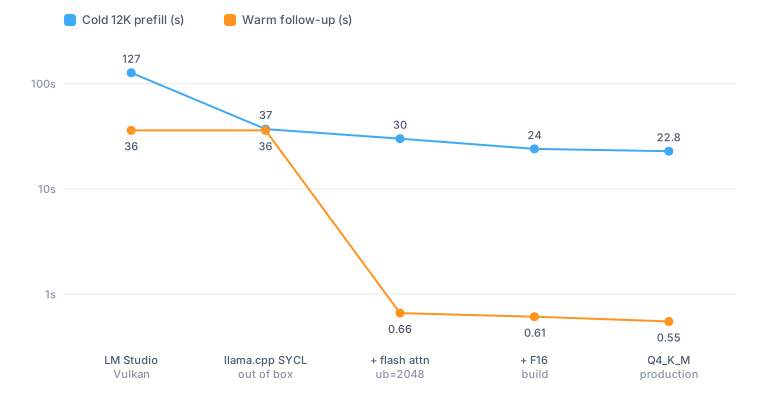
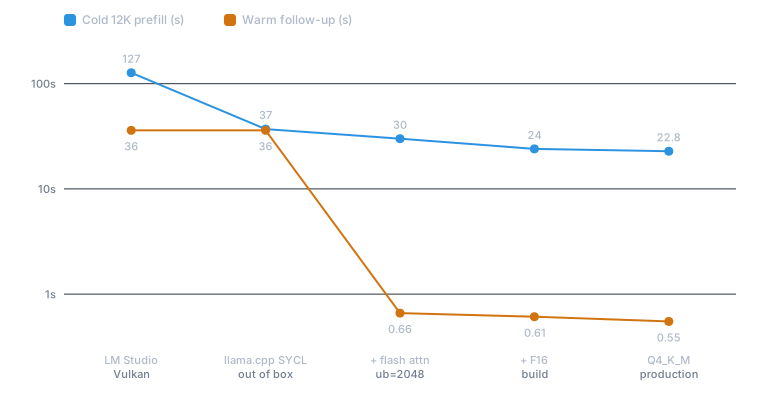
| Stage | Cold 12K prefill | Warm follow-up | Decode | Concurrent 2×4K | Peak VRAM |
|---|---|---|---|---|---|
| LM Studio Vulkan starting point | ~127s at 97 tok/s | 36s | 33.6 tok/s | — | 17.6 GB |
| llama.cpp SYCL, out of box | 37s at 388 tok/s | 36s | 38.4 tok/s | 19.2s | 16.2 GB |
Flash attention on, ub=2048 |
30s at 477 tok/s | 0.66s | 38.6 tok/s | 19.2s | 18.7 GB |
Custom F16=ON build |
24s at 602 tok/s | 0.61s | 40.1 tok/s | 14.8s | 18.2 GB |
| Q4_K_M production configuration | 22.8s at 632 tok/s | 0.55s | 44.1 tok/s | 13.9s | 20.9 GB |
The largest result: prefix-cache reuse
Flash attention mattered less for its arithmetic speed than for the cache path it enabled on this stack:
| Configuration | Follow-up latency | Cache behaviour |
|---|---|---|
| Flash attention off | 36.3s | Full re-prefill |
| Flash attention on | 0.66s | Approximately 99% prefix reuse |
For an agent that makes 8–12 tool calls in one session, this dominates the user experience. A benchmark that records only the first prompt misses it completely.
Build configuration result
Rebuilding llama.cpp with GGML_SYCL_F16=ON produced improvements across the suite:
| Test | F16 off | F16 on | Change |
|---|---|---|---|
| Cold 12K prefill | 477 tok/s | 602 tok/s | +26% |
| Warm follow-up | 0.66s | 0.61s | +8% |
| Decode | 38.6 tok/s | 40.1 tok/s | +4% |
| Concurrent 2×4K wall time | 19.2s | 14.8s | +23% |
| Peak VRAM | 18.7 GB | 18.2 GB | −0.5 GB |
Quantisation result
On this card, the post-training Q4_K_M file beat the Q4_0 quantisation-aware-trained variant:
| Test | Q4_0 QAT | Q4_K_M | Change |
|---|---|---|---|
| Cold 12K prefill | 602 tok/s | 631 tok/s | +5% |
| Warm follow-up | 0.61s | 0.56s | +8% |
| Steady-state decode | 40.1 tok/s | 44.2 tok/s | +10% |
| Concurrent 2×4K wall time | 14.8s | 13.9s | +6% |
| Peak VRAM | 18.2 GB | 20.9 GB | +2.7 GB |
The faster quantisation used more memory, but still fit inside the 24 GB card with workable headroom.
Batch-size result
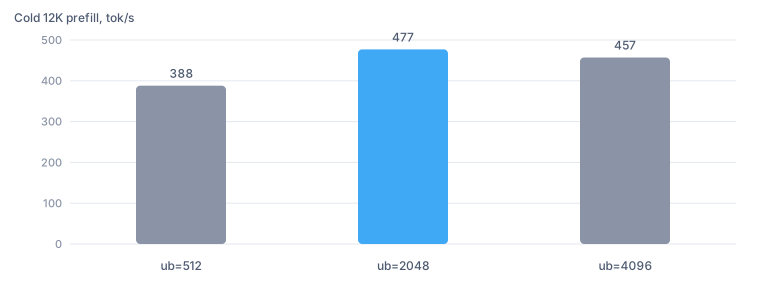
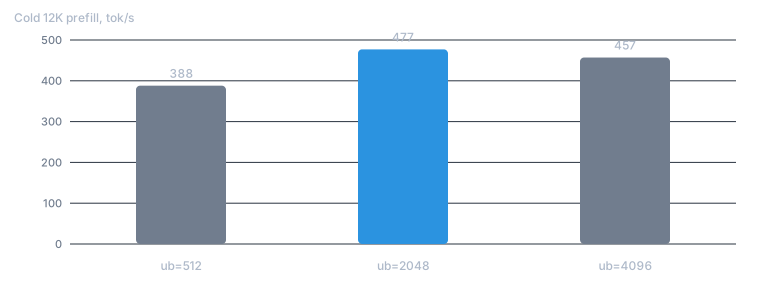
| Physical batch size | Cold 12K prefill |
|---|---|
| 512 | 388 tok/s |
| 2048 | 477 tok/s |
| 4096 | 457 tok/s |
Larger was not always better. 2048 was the useful point on this workload; 4096 regressed.
Before and after
| Metric | Starting point | Production configuration | Improvement |
|---|---|---|---|
| Cold 12K prefill | ~127s | 22.8s | 6.5× |
| Warm follow-up | 36s | 0.55s | 65× |
| Decode | 33.6 tok/s | 44.1 tok/s | +31% |
| First-turn large-diff review | ~180s | ~24s | 7.5× |
| Subsequent tool calls | ~30s | ~0.7s | 42× |
Failure modes worth checking first
| Symptom | What it meant here | Check |
|---|---|---|
| Very low quality or nonsense | Wrong chat template could remove or corrupt the user message | Tokenise a one-sentence probe and inspect the rendered prompt |
| Every tool turn takes 30+ seconds | Shared prefix was being processed again | Compare cold and repeated-prefix timings; verify flash attention/cache reuse |
| Good prefill, slow agent | Decode, tool formatting, or cache behaviour dominated | Run a multi-turn tool workload, not only llama-bench |
| Edit calls fail exact matching | Reasoning/template path rewrote whitespace in snippets | Test real file-edit calls and use a corrected template |
| Second request hangs | Gemma SWA interacted badly with the RAM prompt cache | Test with --cache-ram 0 |
| Bigger batch is slower | Hardware/kernel sweet spot was exceeded | Sweep ub; do not assume 4096 beats 2048 |
| Same greedy prompt, different output | llama.cpp SYCL is non-deterministic even at temp=0: non-associative floating-point reduction under varying work-group scheduling perturbs top-token logits | Expect it on current SYCL builds; do not debug your sampler config first |
| Slow warm turns on one model only | A kernel/driver artifact can masquerade as a model-architecture flaw (see the Ornith warm-cache result below) | Re-test on the current kernel before blaming the model |
| GPU appears PCIe-limited | Capability registers can mislead after link-state changes | Time a cold model transfer; 16.8 GB in ~6s disproved a reported PCIe 1.0 x1 path |
Intel Arc advice that did not survive testing
Several plausible recommendations were stale or wrong on the current Xe2 stack:
- "SYCL flash attention is broken; turn it off." On Ornith 9B, flash attention plus Q8 KV reached about 1,310 tok/s prefill. With it off, the same request failed to return after five minutes.
- "Use
-ub 64on SYCL." A sweep from 16 to 8,192 peaked at 2,048.ub=64produced about 384–391 tok/s;ub=2048produced about 1,604 tok/s on the later Ornith stack. - "A newer compiler must be faster." oneAPI 2026.1 was 2.2% slower on the clean prefill measurement than 2025.3.3 and much noisier on other tests, so production stayed on 2025.3.3.
- "The Intel Docker build is accidentally unoptimised." Adding an explicit Release build produced byte-identical binaries and 1,311 versus 1,310 tok/s: measurement noise.
These are dated findings, not permanent truths. Their value is methodological: Intel's LLM stack is changing too quickly to repeat an old recommendation without rerunning it.
Current model result: Ornith 9B
The current agent and knowledge workload moved from Gemma to Ornith 1.0 9B Q4_K_M. On the B60 it produced approximately 1,200 tok/s prefill and 50 tok/s decode, while also winning the production ingest decision on content quality. A later physical-batch sweep reached 1,604 tok/s at ub=2048 on the smaller synthetic prompt test; that number is not directly comparable to the realistic agent-context measurement.
Update, kernel 7.0 (June 2026): Ornith nearly did not make it this far. On the original VM (kernel 6.14) its warm follow-up took 3.41 seconds against Gemma's 0.46 on identical config, and I shelved it, blaming sliding-window attention in the Qwen3.5 base. Re-benching the same model on bare-metal Ubuntu 26.04 with kernel 7.0.0-14 gave:
| Test | Kernel 6.14 (VM) | Kernel 7.0 (bare metal) |
|---|---|---|
| Decode (256 tok) | ~44 tok/s | 44.6 tok/s |
| Cold ~12K prefill | blocked by warm-cache issue | 1,050 tok/s |
| Warm follow-up | 3.41s | 0.10s |
A 34× warm-path improvement from an OS change, with the model untouched. The head-to-head on the current stack: Gemma 4 26B-A4B with MTP wins decode (48–50 vs 44.6 tok/s); Ornith wins cold prefill (1,050 vs 655 tok/s), warm follow-up (0.10s vs 0.46s), and VRAM (5.6 vs 16.8 GB weights). The rule this bought: a "model is unusable due to architecture" finding may be a kernel or driver artifact, so re-test shelved models after major kernel bumps.
Tested and not promoted: Ornith 35B APEX
The 35B sibling (Ornith 1.0 35B MTP APEX I-Compact, 17 GB, MoE with 3B active parameters) went through the same isolated bench in July 2026 and lost to the 9B in production terms:
| Metric | Ornith 35B APEX | vs Ornith 9B prod |
|---|---|---|
| 5K prefill | 816 tok/s | −33% |
| 12K prefill | 802 tok/s | −10% |
| Decode (5K + 300 gen) | 35.4 tok/s | −32% |
| MTP acceptance | 56.3% | −12 to −20 pp |
| VRAM (32K KV Q8) | ~19 GiB | 1.8× |
The pattern generalises: APEX I-Compact is an IQ-family quantisation, and on Battlemage IQ quants underperform K quants by roughly 28–32% on decode and drop MTP acceptance by 15–22 percentage points. The same held in a Qwen 3.6-35B UD-IQ4_XS sweep. No K-quant + MTP GGUF exists for Ornith 35B yet; if one lands, the family precedent suggests ~45–49 tok/s decode and it earns a re-run. Until then the 9B keeps the slot.
Rerankers are a different race
For reranking, llama.cpp SYCL was correct but not the fastest available Intel path. Hugging Face TEI on XPU-IPEX ran the same cross-encoder workload 7–9× faster, a useful reminder that the best backend can differ by model class: llama.cpp SYCL for chat does not imply llama.cpp for embeddings or rerankers.
What the benchmark now measures
For future model and engine comparisons, I record:
- Cold prefill at realistic 12K and 24K agent contexts.
- Warm follow-up latency with an unchanged conversation prefix.
- Steady-state decode rather than short-burst peak decode.
- Tool-call and tool-response formatting over multiple turns.
- Peak VRAM and host-memory behaviour.
- Concurrent throughput separately from single-user latency.
- Failure recovery and whether the service returns without manual intervention.
The principle is simple: benchmark the system you intend to use, not the number the engine makes easiest to publish.
Related result sets
The local-versus-hosted comparison this record once planned now exists as the three-part LLM Personalities series: briefing agents, choosing an ingest model, and fixing the evaluation harness. Those behavioural results are kept separate from this hardware/runtime record so network latency, provider behaviour, model quality, and local inference performance remain distinguishable.
For the persistence, false starts, and human story behind these measurements, read Intel Arc Pro B60 from disappointing to practical local AI Agents.