Intel Arc Pro B60 from disappointing to practical local AI Agents
I bought a new Intel Arc Pro B60 to run local coding agents. It had 24 GB of VRAM, a modern architecture, and enough memory for the models I wanted to use.
Then I loaded one and got about eight tokens per second.
That was not the experience I thought I had bought. The output arrived slowly enough that I could watch individual ideas form. Worse, an agent does not produce one response and stop. It reads code, calls a tool, receives the result, updates its context, and calls another tool. Every one of those turns was taking more than thirty seconds.
The machine could run the model. It could not yet run the workflow.
Resources: Benchmark record and B60 setup guide · Benchmark scripts and raw data on GitHub
Why persist with local inference?
I was not out to prove that every model should run locally. Frontier APIs are capable, easy to start with, and often the right answer.
My reason was narrower: I wanted local coding agents for cost-sensitive and privacy-focused projects.
Agents consume a lot of tokens. They carry system instructions, tool definitions, files, diffs, and a growing conversation through a sequence of requests. That is useful work, but sustained API use gets expensive. Some projects also contain code and operational context that I prefer to keep on infrastructure I control.
The goal was a private endpoint I could reach remotely and use freely for the work that suited it, not a cloud replacement.
Eight tokens per second left that goal intact. It was disappointing enough that I started wondering what I had missed.
Going back to basics
My first instinct was the common one: try a different model.
I bounced between models ranging from roughly 4B to 30B parameters. Smaller models were not always faster in the ways that mattered. Larger models sometimes fit but behaved poorly. A model that looked promising in a benchmark could struggle with tool calls, and an engine with an impressive prefill number could still feel painfully slow during an agent session.
I also changed runtimes. Some were easy to operate but slow on this hardware. Some were fast at one phase of inference and fragile in another. Some supported the model but not its tool-call format. Others changed rapidly enough that advice written a few months earlier no longer described the current build.
Eventually I stopped asking which model was "best." I froze one ordinary workload and started testing the system.
The workload was deliberately unremarkable: simple coding and code-review tasks. Inspect some code. Make a small change. Review the result. Repeat. If a stack could not make everyday work responsive, a synthetic peak-throughput number did not matter.
From there, the method was simple:
- Establish a repeatable baseline.
- Separate prompt processing from token generation.
- Measure the first request and repeated turns independently.
- Change one variable at a time.
- Validate that tools still worked, not merely that text arrived faster.
- Keep the changes that improved the real workload.
There was no predetermined target. I researched techniques, tested them, and validated the results. The aim was to keep following the evidence until the workflow stopped being frustrating.
The engine mattered as much as the model
One of my more expensive assumptions was that the hardware had a fixed level of performance and the model mostly determined what I would get from it.
In practice, the inference engine mattered enormously.
I initially avoided one path because an upstream report described SYCL performance on Battlemage as "brutally bad." That advice had been reasonable when it was written. It was also stale. A newer llama.cpp Intel container contained substantial improvements, and on the same card it reversed several conclusions I had formed from the older ecosystem.
That became a recurring pattern. Engine releases changed kernel behaviour. Model support appeared. Chat templates were fixed. A build option that had been irrelevant became measurable. Community recommendations that sounded plausible failed when tested against the current software and this particular GPU.
The environment was moving faster than the advice about it.
Intel's official stack taught the same lesson from the other direction. LLM-Scaler, the vendor's vLLM-XPU container, posts prefill numbers that llama.cpp SYCL cannot touch, built on hand-written XMX attention kernels. For my single-user agent loop it still lost. The loop lives on decode speed and prefix-cache reuse, quantised models fit more VRAM under llama.cpp, and model coverage gaps ruled out some candidates outright. Treat the official stack as one more candidate to benchmark, not the assumed answer.
The pace makes standing still expensive. Engine updates, new model families, and new techniques such as multi-token prediction arrive weekly, and each can invalidate a conclusion you wrote down a month ago.
There is also headroom left on the table, because the software has not fully implemented the Intel hardware yet. The B60's matrix engines sit mostly idle under llama.cpp today: its SYCL attention path runs scalar FP16 without touching the XMX units, and quantised weights are dequantised to FP16 before every matrix multiply, leaving the doubled INT8 rate unused. Each engine release closes a little more of that gap. The eight-tokens-per-second card was never the hardware's ceiling, and the current numbers aren't either.
The lesson: treat documentation and community experience as hypotheses. Read the docs, inspect the dates, then test the current build on the workload you care about.
The breakthrough was not token generation
Decode speed improved incrementally. The original result climbed into a range where generated code streamed faster than I read it.
Prefix-cache reuse made the agent usable, more than any decode gain.
An agent sends most of the same conversation back on every turn. The system prompt, tools, files, and previous messages form a large shared prefix. A functioning cache lets the engine reuse that work and process only what changed.
Mine was doing no such thing. Each tool result triggered another expensive prefill. The model would inspect a file, wait more than thirty seconds, call a tool, wait another thirty seconds, and continue like that through the task.
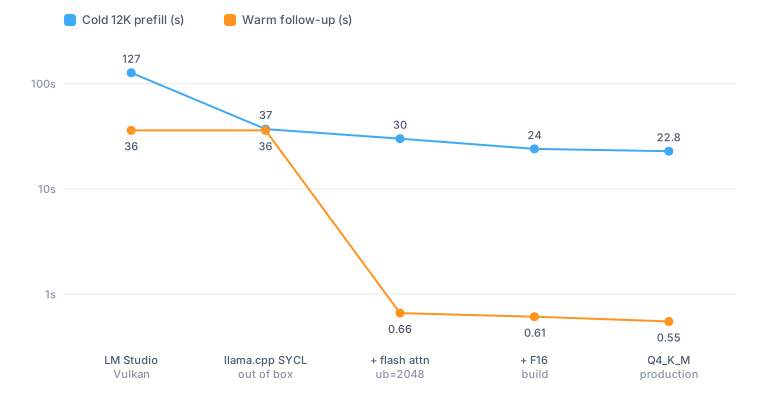
With the right engine path and flash attention enabled, cache reuse began working. A repeated turn that had taken more than thirty seconds dropped to roughly 0.66 seconds.
That number changed the character of the system. The first request could still take time; loading and processing a large context is real work. But after that, the agent moved through its tools without long stretches of dead air. It felt like a tool instead of a demonstration.
No single optimization won
Cache reuse was the largest individual improvement, but the final result was cumulative.
Choosing the right engine helped. Updating that engine helped again. Physical batch sizing mattered. A build configuration improved prompt processing. A different quantisation traded more VRAM for faster decode. Correct chat-template handling stopped models from losing track of tool results. Later, speculative decoding via multi-token prediction (MTP) became worthwhile after the surrounding software improved.
Several plausible changes did nothing. Some made performance worse. A few conclusions I had written down as final were overturned within weeks.
The flags are not universal, but they are useful evidence. On this B60, the decisive Gemma configuration was llama.cpp's SYCL backend with flash attention, -b 2048 -ub 2048, all layers offloaded with -ngl 99, the GGUF's Jinja chat template, and a build compiled with GGML_SYCL_F16=ON. Moving ub from 512 to 2048 raised cold prefill from 388 to 477 tok/s; 4096 regressed. The F16 build then raised it to 602 tok/s. Switching from Q4_0 QAT to Q4_K_M reached 632 tok/s and 44.1 tok/s decode, at the cost of 2.7 GB more VRAM.
Those details contradict several common shortcuts for Intel GPUs. SYCL was not slower than Vulkan on the current stack. Flash attention enabled the prefix-cache behaviour that made the agent loop usable, which mattered far more than its kernel arithmetic. The largest batch was not the fastest. The quantisation with "QAT" in its name was not the best-performing file on this workload.
The complete measurements, launcher, and dated configurations live in the separate local LLM benchmark and B60 setup guide. They are a reproducible starting point, not a universal recipe.
The appropriate engine and model depend on the intended use case and required outcome. A coding agent, knowledge-ingestion worker, reranker, and interactive assistant reward different tradeoffs. One might need long-context reasoning; another needs parallel throughput; another needs strict structured output; another needs the lowest possible latency.
Benchmark the job, not the model in isolation.
Gemma was not the ending
Gemma 4 was the model that made the original coding-agent setup practical. Rounded to the level that matters for this story, the tuned system produced roughly:
| Model | Prefill | Decode |
|---|---|---|
| Gemma 4 26B-A4B | ~600 tok/s | ~40 tok/s |
That was already a dramatic improvement over the eight-token-per-second start. Repeated turns improved more: over thirty seconds became well under one second.
Then the environment moved again.
New models arrived, workloads changed, and I ran more evaluations. Ornith 9B, a much smaller model, became the better fit for several local agent and knowledge tasks:
| Model | Prefill | Decode |
|---|---|---|
| Ornith 9B | ~1,200 tok/s | ~50 tok/s |
Ornith nearly missed the shortlist. On the original setup its warm turns took 3.4 seconds against Gemma's 0.46, and I shelved it, blaming sliding-window attention in the model's architecture. A later OS move to kernel 7.0 dropped the same model's warm follow-up to 0.10 seconds. The "architectural" flaw was a kernel and driver artifact, one more entry in the pile of conclusions the moving stack overturned. Re-test your shelved models after a major kernel bump.
The smaller model was better for those tested jobs, nothing more universal than that. On the agent-search evaluation, its result was statistically tied with the hosted comparison while completing requests locally with lower latency. On categorisation work, it performed strongly enough to replace larger models in the production path.
That outcome is why this article cannot end with a winning configuration. Gemma was the breakthrough, and Ornith was the next fit, not the final model the industry will produce.
For the detailed evaluation results, and the human failure modes behind similar scores, see Interviewed seven LLMs for the same job.
What I would repeat
If I started again on different hardware tomorrow, I would not begin by copying my current launcher. I would repeat the method:
- Choose one real workload. Use ordinary work you want the system to complete.
- Establish a baseline. Record the bad result before changing anything.
- Separate the phases. Prefill, decode, repeated-turn latency, and concurrency are different measurements.
- Change one variable. Engine, model, quantisation, build, or runtime flag, one at a time.
- Validate behaviour. A faster model that loops on tools or produces invalid output is not an improvement.
- Test hosted twins when possible. Otherwise you may be judging your serving stack rather than the model.
- Revisit old conclusions. Engine releases, kernel versions, and model architectures change quickly enough to invalidate good advice.
- Choose for the outcome. Privacy, cost, latency, quality, throughput, and operational simplicity do not point to one universal winner.
The short version for another B60 owner
If your Intel card is producing disappointing LLM results, check these before judging the hardware:
- Use a current llama.cpp Intel/SYCL build, not an old Battlemage report as a proxy for current performance.
- Confirm the model prompt is intact and the correct Jinja chat template is active; a serving error can look like a bad model.
- Turn flash attention on and test a repeated-prefix request. Measure the warm follow-up separately from cold prefill.
- Sweep physical batch size. On my B60,
-ub 2048was the peak; the often-recommended64was roughly four times slower in a later Ornith sweep. - Compare quantisations empirically. Q4_K_M beat Q4_0 QAT here, but used more VRAM.
- Validate tool calls and multi-turn behaviour after every speed change.
The card was not an eight-token-per-second card. That was one immature path through a rapidly changing software stack.
I did not find the perfect local LLM stack. I learned that disappointing performance was not a verdict. It was a measurement, and measurements give you somewhere to start.
Related reading: Hardware, engines, and benchmark results · LLM Personalities series: Part 1: The briefing mattered more than the hire · Part 2: One knowledge base, two AI jobs · Part 3: The evaluation harness was wrong too